Real Estate Market Update | Muskoka, January-September 2018

OCTOBER 31, 2018

As the third quarter of 2018 came to an end, it remained unclear if a shift was taking place in the broader Muskoka and area marketplace. Generally, we see declines in the number of waterfront, recreational properties sold, concurrently with a strengthening of average sale prices, except for some isolated markets. At the same time inventory levels have increased in some regions, a shift from the previous three years which witnessed sharp declines.

In the broader market, year-to-date 1,126 recreational properties were reported sold in Bracebridge, Gravenhurst, Huntsville, Lake of Bays and the Muskoka Lakes. Last year 1,140 properties were reported sold over the same period, a mere decline of just over 1 percent.

Notwithstanding the foregoing not all markets and regions are performing similarly, as is demonstrated by an analysis of the market activity on Muskoka’s big lakes.

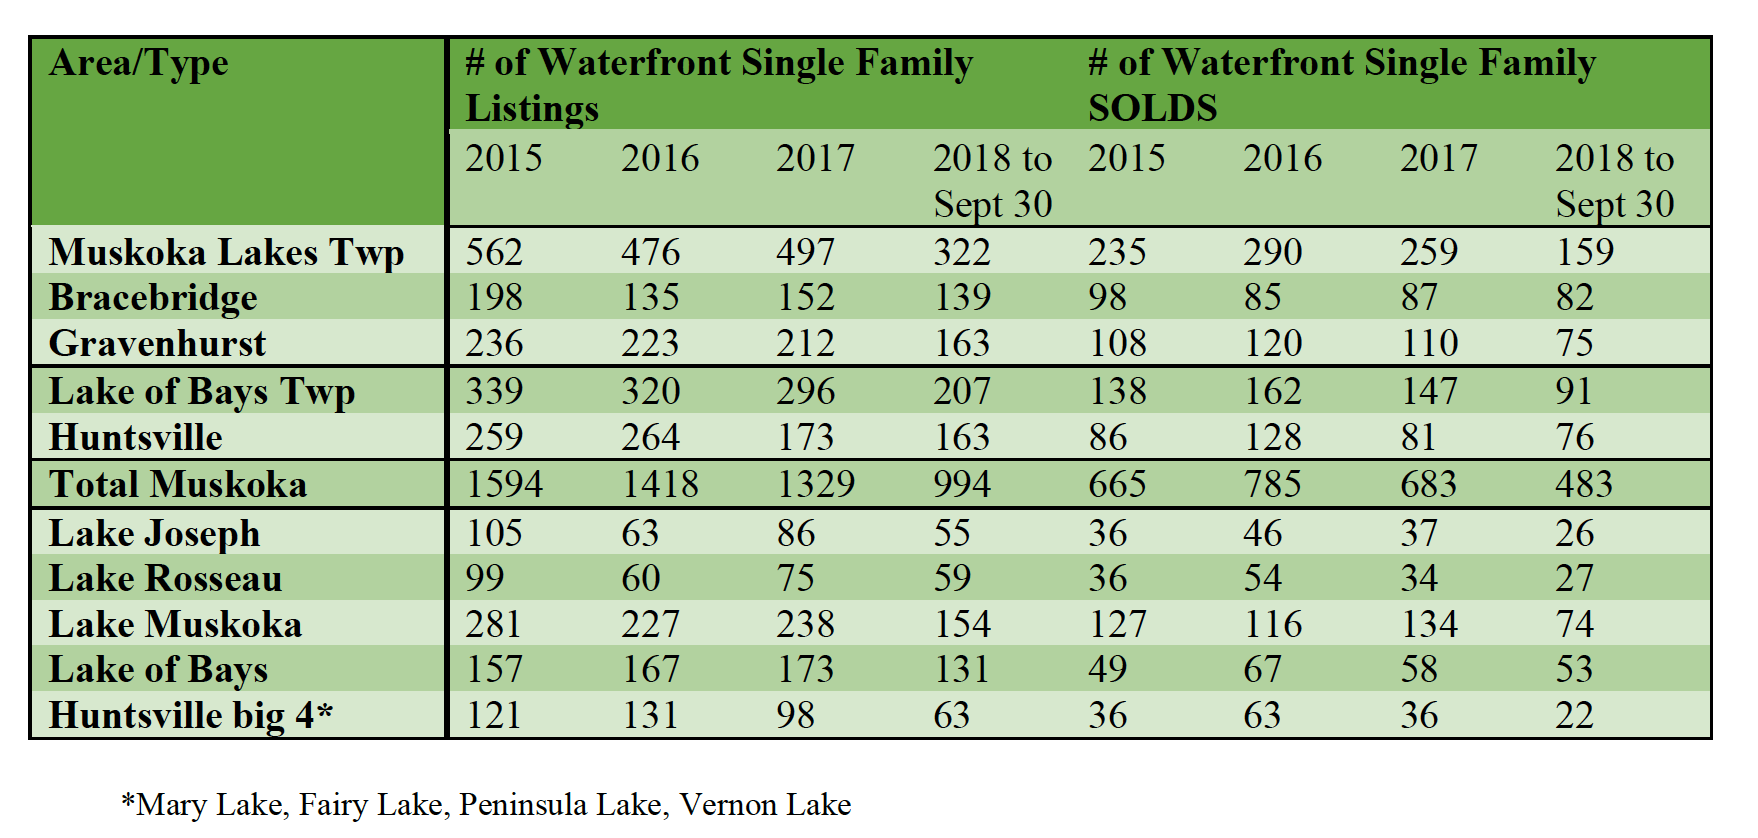
Lake Muskoka and Lake Joseph saw fewer listings come to market during 2018 than the same period in 2017. Last year 819 properties came to market during the first 9 months of the year on Muskoka’s big lakes. This year that number declined to 733, approximately 10 percent fewer listings than to September 2017. Not only did listings decline, but sales on the big lakes also drifted downward in 2018. There were 28 waterfront sales reported on Lake Joseph during the first 9 months of 2018. Last year there were 31. This year 27 waterfront properties were reported sold on Lake Rosseau, a slight drop from 31 sales that took place last year. In the case of Lake Muskoka, the decline was more significant. Reported sales decreased by more than 21 percent, from 156 to 123 properties.

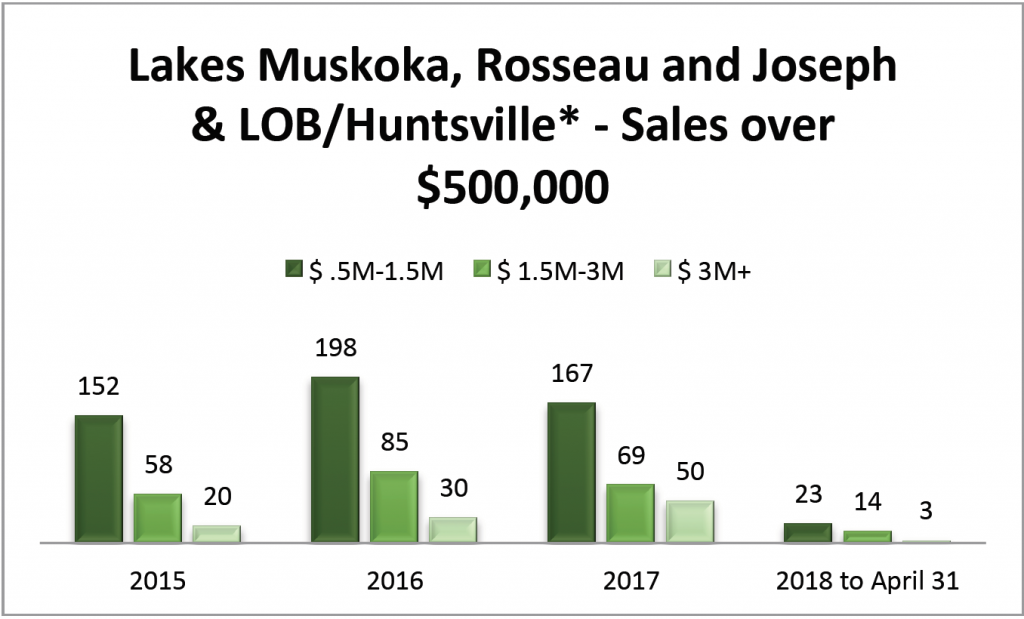
Significantly the largest declines in reported sales on the big lakes were properties having a sale price of $3 Million or more. In 2017 there were 41 waterfront properties reported sold having a sale price of $3 Million or more. This year (as of the end of September) only 19 were reported sold in this category, a decline of more than 50 percent. Explanations for these declines vary: lack of good inventory, increasing cost of money, and longer-term concerns related to Canada’s financial stability. The recent turmoil in the world’s equity markets is likely to further aggravate this market price point.

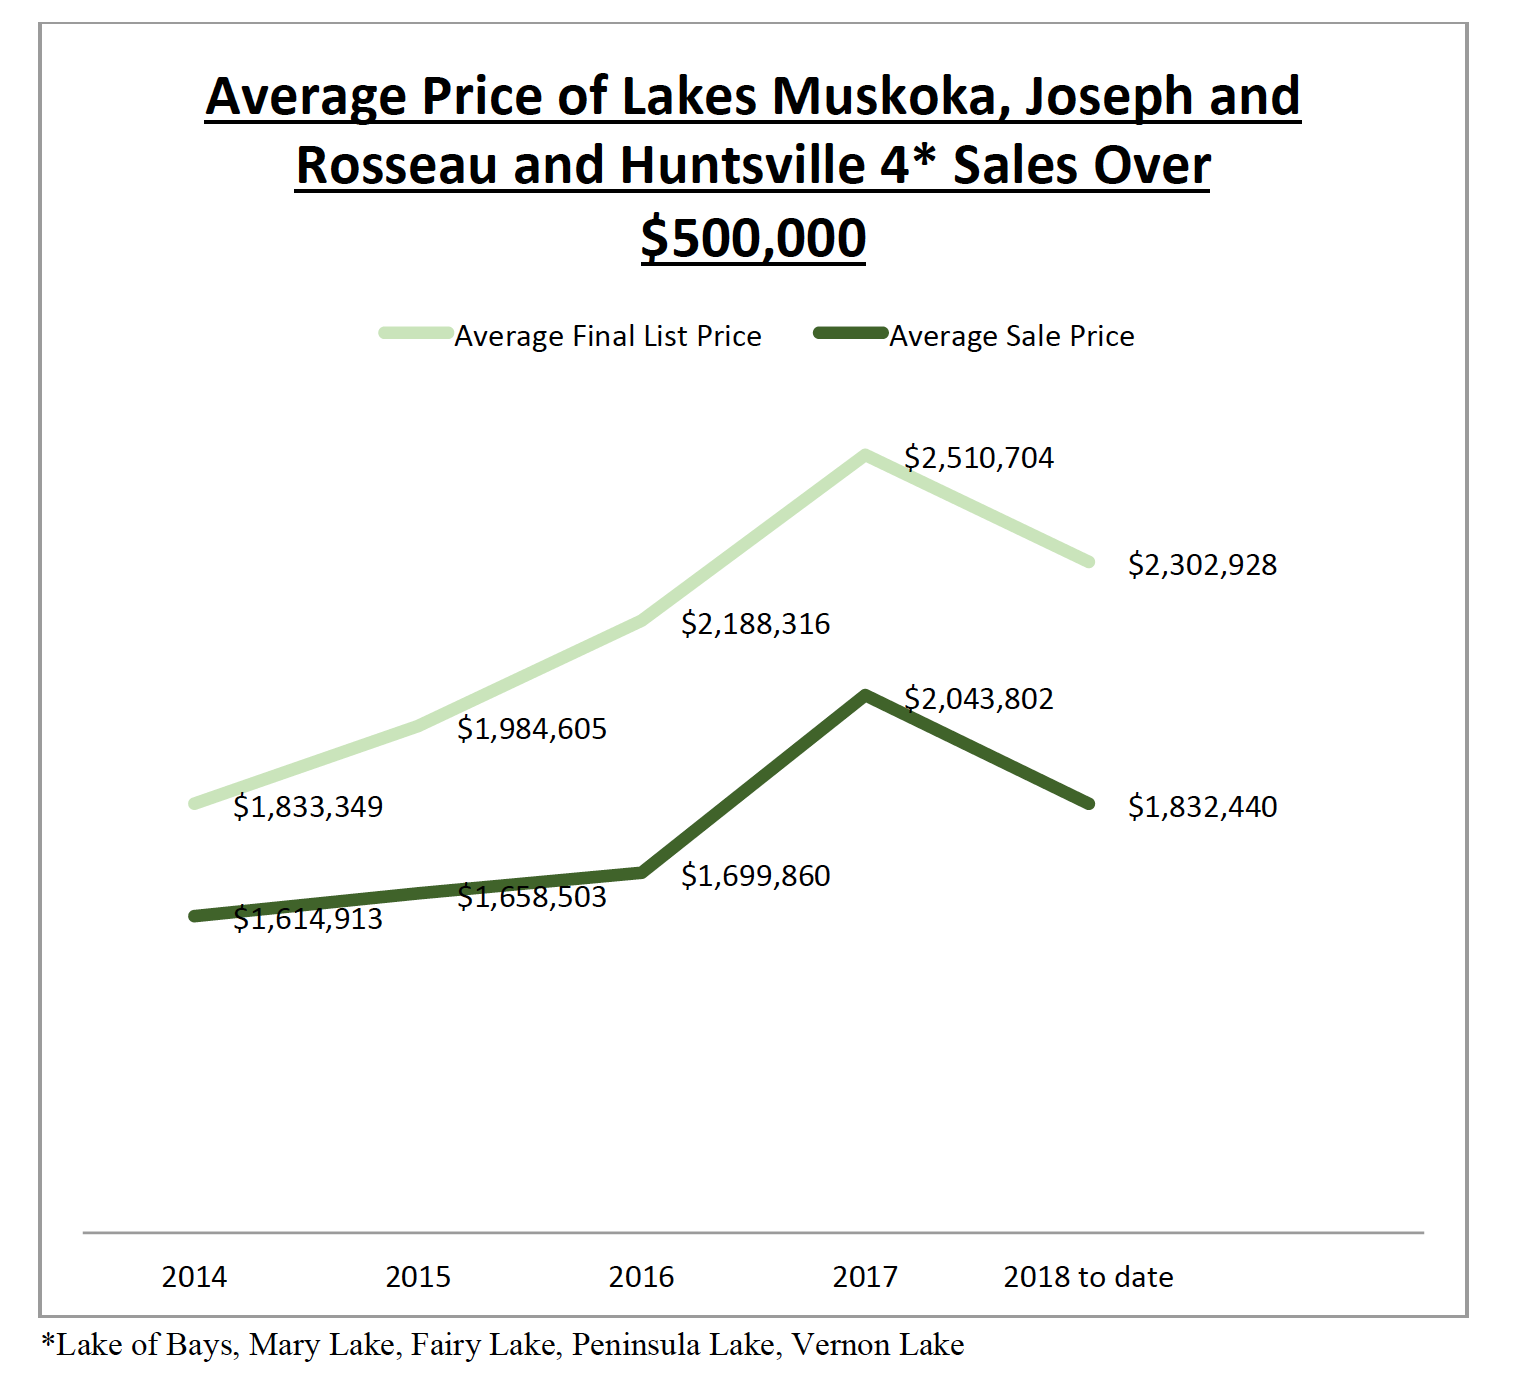
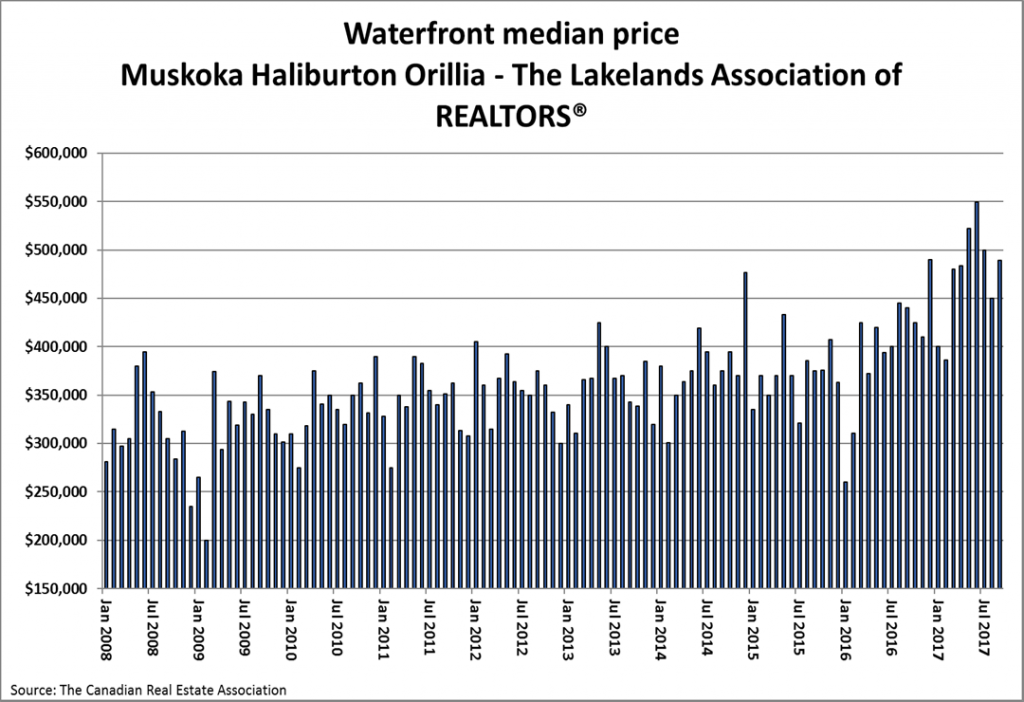
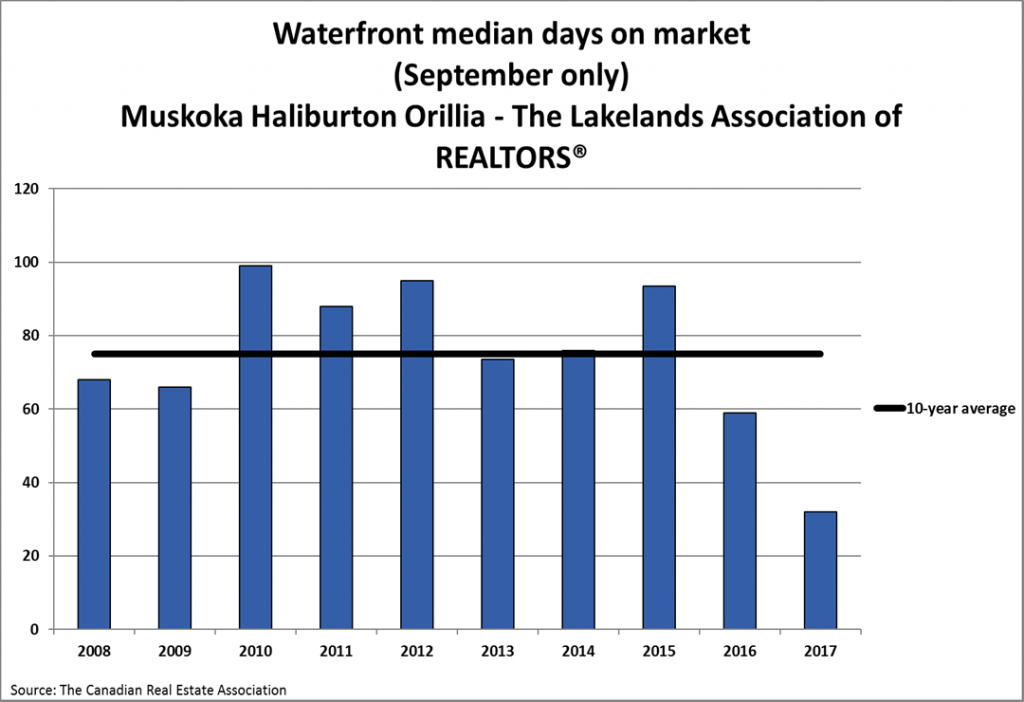
It is not surprising that the average sale price for properties representing sales over $500,000 on Muskoka’s big lakes has declined year-over-year. Last year the average sale price for all properties sold in this category came in at $2,189,793. This year that number has dropped to $2,101,323. Clearly more properties with lower price points were selling than higher priced recreational properties. This represents a decline of approximately 5 percent. Days on market for properties in this category increased marginally.

In the broader markets listing inventories are increasing, particularly in the lower price points, although no distinct pattern is evident that allows for market-wide conclusions or patterns. For example, in the Muskoka Lakes region, new listings increased in all price categories, particularly properties with a list price of less than $1 Million. Conversely, in the Huntsville-Lake of Bays region, new listings declined by more than 20 percent, with a 30 percent corresponding decline in sales. It would appear that a market inflection is occurring, but there is insufficient data to accurately explain or define what is happening.

Chestnut Park and its sales representatives continue to dominate the Port Carling office marketplace. Chestnut Park’s dollar volume sales exceeded the closest competitive office by more than 37 percent. Year-to-date Chestnut Park’s sales representatives have completed more than $251 Million in recreational property sales, only slightly off the record high sales of 2017, and were responsible for the sale of 3 properties having a sale price that exceeded $10 Million.

Urban markets have undergone pronounced changes in 2018. This is due primarily to the disappearance of cheap and easy money. There have been five interest rate hikes and now lending institutions are stress testing conventional borrowers. It would appear that this is the new normal and that for the foreseeable future we can anticipate rising interest rates and the continued disappearance of easy money. The natural consequence of these factors is stable and even lower sale prices. In Toronto and area, we have seen a moderation in sales and average sale prices as the cost of money has made exuberant buying prohibitive. There is little doubt that this will influence the recreational market, particularly if inventory levels continue to increase across the entire recreational marketplace. Due to the seasonal nature of the Muskoka and area recreational marketplace, the impact of these broader economic changes will not become apparent until the Spring of next year.

Prepared by:

Chris Kapches, LLB, President and CEO, Broker

Muskoka Market Watch – September 2018

Muskoka Market Watch – September 2018


Number of Listings and Sales

Unit Sales Volume – Summary of Waterfront Single Family MLS® Listings and Sales for the last 4 years by area as reported by The Lakelands Association of REALTORS® in the Muskoka Market.

Muskoka Market Watch Chart 1


Sales by Price Range

Summary of Waterfront Cottage MLS® Listings and Sales for the last 4 years by area and price range as reported by The Lakelands Association of REALTORS®

The Cottage Sales by Year and Price Range

*Lake of Bays, Mary Lake, Fairy Lake, Peninsula Lake, Vernon Lake


Sales in May 2018

The Lakelands Association of REALTORS®

Lakelands property sales remain well below last year’s record levels in May 2018

  • chart 4
  • chart 5
  • chart 5

Sales of waterfront properties recorded through the MLS® System for the Lakelands region numbered 191 units in May 2018. This decreased by 42.1% from May 2017, which was a record.

On a year-to-date basis, waterfront sales totalled 492 units over the first five months of the year. This was a decrease of 39% from the same period in 2017.

“Activity remained quiet in May,” said Mike Stahls, President of The Lakelands Association of REALTORS®. “Having said that, with supply at historic lows it’s possible we may be looking as much at a supply story as a demand story. That idea is supported by the fact that listings are still selling quickly, and median prices continue to rise.”

The median price for waterfront property sales in May 2018 was $535,500, up 9.4% from May 2017.

The total dollar value of all waterfront sales in May 2018 was $140.7 million, falling 34.2% from the May record in 2017.

Summary – Sales by Housing Type
Category May 2018 May 2017 Year-over-year
percentage change
Non-Waterfront Residential 237 399 -40.6
Waterfront 191 330 -42.1
Includes transactions in all areas recorded by The Lakelands Association of REALTORS®
Summary – Median Price by Housing Type
Category May 2018 May 2017 Year-over-year
percentage change
Non-Waterfront Residential $340,000 $319,900 6.3
Waterfront $535,500 $489,500 9.4
Includes transactions in all areas recorded by The Lakelands Association of REALTORS®


(Use button if the table information did not load properly)

Detailed – Non-Waterfront Residential Sales and Median Price by Area
Non-Waterfront Residential
By Area Unit Sales Median Sale Price
May 2018 May 2017 Year-over-year
percentage
change
May 2018 May 2017 Year-over-year
percentage
change
Muskoka 81 153 -47.1 $365,000 $330,000 10.6
Haliburton 24 25 -4.0 $231,750 $209,000 10.9
Orillia 76 120 -36.7 $387,500 $390,000 -0.6
Parry Sound 41 86 -52.3 $275,900 $207,750 32.8
All Other Areas 15 15 0.0 $469,900 $302,500 55.3
Note: A percentage change of — indicates there were no sales in the same month one year ago.
Detailed – Waterfront Sales and Median Price by Area
Waterfront
By Area Unit Sales Median Sale Price
May 2018 May 2017 Year-over-year
percentage
change
May 2018 May 2017 Year-over-year
percentage
change
Muskoka 74 111 -33.3 $720,000 $600,000 20.0
Haliburton 40 57 -29.8 $470,500 $510,000 -7.7
Orillia 18 27 -33.3 $560,950 $610,000 -8.0
Parry Sound 44 111 -60.4 $412,500 $390,000 5.8
All Other Areas 15 24 -37.5 $525,000 $465,000 12.9
Note: A percentage change of — indicates there were no sales in the same month one year ago.

BOARD & ASSOCIATION INFORMATION

The area served by 800 REALTORS® who belong to The Lakelands Association of REALTORS® serving Parry Sound, Muskoka, Haliburton and Orillia, is located less than a two-hour drive north of Toronto, in the heart of Canada’s Cottage Country. There are several major geographical areas within the Association’s boundaries, including the City of Orillia, the Parry Sound area, Gravenhurst, Bracebridge, Muskoka Lakes, Huntsville, Lake of Bays and Haliburton. Each of these areas has a unique blend of properties ranging from residential homes in the City of Orillia and smaller towns to the rural areas in-between, as well as a mix of waterfront homes/cottages on the many rivers and lakes throughout our regions that range from the smaller entry-level properties to the prestigious.

Muskoka Cottage Market Watch – April 2018


Number of Listings and Sales of Muskoka Cottages

Unit Sales Volume – Summary of Waterfront Single Family MLS® Listings and Sales for the last 4 years by area as reported by The Lakelands Association of REALTORS®

*Mary Lake, Fairy Lake, Peninsula Lake, Vernon Lake

Sales by Price Range

Summary of Waterfront Cottage MLS® Listings and Sales for the last 4 years by area and price range as reported by The Lakelands Association of REALTORS®

The Cottage Sales by Year and Price Range

*Lake of Bays, Mary Lake, Fairy Lake, Peninsula Lake, Vernon Lake

Lakelands property sales running at average levels in February 2018

– down from a very strong February in 2017

  • chart 4
  • chart 5
  • chart 5


Sales of waterfront properties recorded through the MLS® System for the Lakelands region numbered 36 units, down 34.5% from February 2017. This was almost exactly in line with the 10-year average for the month of February.

On a year-to-date basis, waterfront sales (72) were down 30.1% from the same period in 2017.

“Sales activity was running at average levels in February, less extreme activity than we saw in early 2017,” said Mike Stahls, President of The Lakelands Association of REALTORS®. “That said, even average levels of demand against the backdrop of a historic lack of inventory is keeping the pressure on prices in the region.”

The median price for waterfront sales was $459,000 in February 2018, rising 8% from February 2017.
The total value of waterfront sales was $20.4 million, falling 24% from the record February in 2017. This drop in dollar value was due to the slowdown in sales.

Summary – Sales
February 2018 February 2017 Year-over-year
percentage change
36 55 -34.5
Includes transactions in all areas recorded by The Lakelands Association of REALTORS®
Summary – Median Price
February 2018 February 2017 Year-over-year
percentage change
$459,000 $425,000 8.0
Includes transactions in all areas recorded by The Lakelands Association of REALTORS®


(Use button if the table information did not load properly)

Detailed – Waterfront Sales and Median Price by Area
Waterfront
By Area Unit Sales Median Sale Price
February 2018 February 2017 Year-over-year
percentage
change
February 2018 February 2017 Year-over-year
percentage
change
Muskoka 10 16 -37.5 $397,500 $525,000 -24.3
Haliburton 10 10 0.0 $444,500 $284,500 56.2
Orillia 7 9 -22.2 $500,000 $740,000 -32.4
Parry Sound 9 14 -35.7 $535,000 $317,500 68.5
All Other Areas 0 6 -100.0 $0 $466,500 -100.0
Note: A percentage change of — indicates there were no sales in the same month one year ago.

BOARD & ASSOCIATION INFORMATION

The area served by 800 REALTORS® who belong to The Lakelands Association of REALTORS® serving Parry Sound, Muskoka, Haliburton and Orillia, is located less than a two-hour drive north of Toronto, in the heart of Canada’s Cottage Country. There are several major geographical areas within the Association’s boundaries, including the City of Orillia, the Parry Sound area, Gravenhurst, Bracebridge, Muskoka Lakes, Huntsville, Lake of Bays and Haliburton. Each of these areas has a unique blend of properties ranging from residential homes in the City of Orillia and smaller towns to the rural areas in-between, as well as a mix of waterfront homes/cottages on the many rivers and lakes throughout our regions that range from the smaller entry-level properties to the prestigious.

Waterfront sales remain at average levels in September 2017


Sales of waterfront properties recorded through the MLS® system of Muskoka Haliburton Orillia – The Lakelands Association of REALTORS® came in 25.3% below last September’s record. On a year-to-date basis, waterfront sales were down 14.4% from the first three quarters of 2016.

The waterfront figures for September 2017 stood in between the five and 10-year averages for the month of September.

“Sales of waterfront properties have slowed from record levels this spring to more normal levels over the summer and fall, in line with trends seen across the Greater Golden Horseshoe region,” said Mike Stahls, President of Muskoka Haliburton Orillia – The Lakelands Association of REALTORS®. “That said, prices are up year over year on fewer sales, and months of inventory decreased again slightly over the previous month.”

The median price for waterfront sales was $489,500 in September 2017, rising 11.3% from September 2016.

The value of all residential non-waterfront sales in September 2017 totalled $55.4 million, edging down 1.1% from September 2016.

The total dollar value of waterfront sales was $154.1 million, down 7.9% from September 2016.


BOARD & ASSOCIATION INFORMATION

The area served by the more than 700 REALTORS® who belong to The Lakelands Association of REALTORS® serving Muskoka, Haliburton and Orillia, is located less than a two-hour drive north of Toronto, in the heart of Canada’s Cottage Country. There are several major geographical areas within the Association’s boundaries, including the City of Orillia, Coldwater, Gravenhurst, Bracebridge, Muskoka Lakes, Huntsville, Almaguin Highlands, Lake of Bays, and Haliburton Highlands. Each of these areas has a unique blend of properties ranging from residential homes in the City of Orillia and smaller towns to the rural areas in-between, as well as a mix of waterfront homes/cottages on the many rivers and lakes throughout our regions that range from the smaller entry level properties to the prestigious.

Real Estate Market Update | Muskoka January-June 2017

Cottage Market

In April the provincial Liberal Government proposed the Ontario Fair Housing legislation, a bundle of measures to make housing fairer and more affordable for Ontario tenants and buyers. Although the proposed legislation – now law related to tenants – will have an Ontario-wide application, the legislation to make housing more affordable for buyers has a narrow application, affecting what is known as the golden horseshoe. The northern boundaries of the golden horseshoe extent to southern Georgian Bay. As a result, the Muskoka and area region is not caught by the new legislation.

Specifically, the new legislation will impose a 15 percent of purchase price tax if the buyer is a “foreign entity”. In other words, if the buyer is not a resident of Canada or a Canadian citizen.  There are numerous exemptions, but since the legislation does not apply to buyers and transactions in the Muskoka and area market place, a detailed explanation of these exemptions is beyond the scope of this Report.

The foreign buyers tax has had an immediate and dramatic impact on the Toronto and area market place. Since April 20th when the legislation was announced, sales have dropped by more than 30 percent, and the average sale price today compared to the mid-April high of $949,000 is almost $200,000 less. Since even the highest estimates indicate that only 5 percent of all purchases in the Toronto area market place were by foreign buyers, the new tax should not have had the dramatic impact that it has had. The effect is clearly psychological more than actual, since none of the area’s economic fundaments have changed.

Since the tax does not apply to transactions in the Muskoka and area market place, it should be of little importance, except for the possibility of the psychological spill-over effect seeping into the market place from the lack of market activity in the greater Toronto area.

As of the date of preparation of this Report there is no noticeable impact of the foreign buyer’s tax in the Muskoka and area market place. The main concern for the area is lack of inventory of recreational properties for sale. At the end of June, the Muskoka – Haliburton Association of Realtors had only 766 available recreational listings. This compares with 1187 for the same period last year, a decline of 35 percent. In 2015 there were 1511 active listings.

The situation is similar in all regions. In the Haliburton Highlands listings are down by 35 percent compared to the same period last year (272 to 175). In Lake of Bays the decline is 37 percent (128 to 80) and on Muskoka’s big lakes the decline is a little better at 31 percent (343 to 236). In 2015 the inventory levels were even higher than in 2016.

It comes as no surprise that with declining inventories the pattern of sales is somewhat fractured. Overall sales of recreational properties for the region were up by 3.2 percent compared to June 2016. In May they were up by 12 percent.

Sales on Muskoka’s big lakes were up by 10 percent. In May the year-to-date increase compared to last year was 19 percent. On Lake of Bays sales increased by a stunning 47 percent year-to-date. In May the increase was 45 percent.

For the second month in a row the only region showing a decline in sales is the Haliburton Highlands. In May the year-to-date decline was 10 percent. The market posted a further decline of 9.3 percent in June. Since the Haliburton Highlands region has had the greatest declines in inventory this year, these declines in sale, are probably inventory driven rather than by a lack of demand.

It is not surprising that under theses market circumstances that average sale prices continue to rise. For example, in June the average sale price for all recreational properties reported sold (with a sale price of $500,000 or more) on Lake Rousseau, Lake Joseph and Lake Muskoka, Muskoka’s big lakes, was $2,318,465. This represents a 5 percent increase compared to last June’s average sale price of $2,213,371.

Notwithstanding these declines in inventory Chestnut Park and its sales representatives have outpaced the overall recreational market place. On a year-to-date basis sales are up by more than 7 percent compared to last year, which was the strongest year in the firm’s history, and the dollar volume of sales has increased by more than 27 percent.

For the time-being reduced inventory levels continue to put pressure on buyers, as they are being forced to pay more for desirable recreational properties. A phenomenon normally associated with the Toronto market place, namely multiple buyers bidding for the same property, is now more common in the region. Unless the market becomes impacted by the new provincial tax on foreign buyers, we can anticipate the market place continuing to tighten. At this point it is difficult to foresee what might drive sellers of recreational properties to bring their properties to market. After all, recreational properties are not traded for the same reasons as urban transactions. These sales are discretionary on the part of buyers, and driven by circumstances on the part of Sellers.

Prepared by: Chris Kapches, LLB, President and CEO, Broker

Muskoka Haliburton Orillia – The Lakelands Association of REALTORS® May Report

  • chart 4
  • chart 5
  • chart 5

Sales of waterfront properties recorded through the MLS® system of Muskoka Haliburton Orillia – The Lakelands Association of REALTORS® came in just two sales below last May’s record.

On a year-to-date basis, waterfront sales were up 2.9% from the first five months of 2016. This was the highest level on record for this period.

“At this point the local housing market appears to be on its way to another record year in 2017,” said Mike Stahls, President of Muskoka Haliburton Orillia – The Lakelands Association of REALTORS®. “That said, housing markets not too far south of Cottage Country cooled in May in the wake of recently announced changed to Ontario housing policy. That did not seem affect our area in May, but it will be worth keeping an eye out in the months ahead for any signs of those Greater Golden Horseshoe demand and supply trends creeping into the Muskoka, Haliburton and Orillia areas.”

The median price for waterfront sales was $522,500 in May 2017, rising 24.4% from May 2016.

The total value of waterfront sales was $164.2 million, up 1.2% from May 2016.

Summary – Sales by Housing Type
Category May 2017 May 2016 Year-over-year
percentage change
Waterfront 242 244 -0.8
Includes transactions in all areas recorded by Muskoka Haliburton Orillia – The Lakelands Association of REALTORS®
Summary – Median Price by Housing Type
Category May 2017 May 2016 Year-over-year
percentage change
Waterfront $522,500 $420,000 24.4
Includes transactions in all areas recorded by Muskoka Haliburton Orillia – The Lakelands Association of REALTORS®


Detailed – Waterfront Sales and Median Price by Area
Waterfront
By Area Unit Sales Median Sale Price
May 2017 May 2016 Year-over-year
percentage
change
May 2017 May 2016 Year-over-year
percentage
change
Muskoka 165 156 5.8 $515,000 $429,500 19.9
Haliburton 57 55 3.6 $510,000 $399,000 27.8
Orillia 19 33 -42.4 $650,000 $410,000 58.5
All Other Areas 1 0 $445,000 $0
Note: A percentage change of — indicates there were no sales in the same month one year ago.

BOARD & ASSOCIATION INFORMATION

The area served by the more than 700 REALTORS® who belong to Muskoka Haliburton Orillia – The Lakelands Association of REALTORS® serving Muskoka, Haliburton and Orillia, is located less than a two-hour drive north of Toronto, in the heart of Canada’s Cottage Country. There are several major geographical areas within the Association’s boundaries, including the City of Orillia, Gravenhurst, Bracebridge, Muskoka Lakes, Huntsville, Almaguin Highlands, Lake of Bays and Haliburton. Each of these areas has a unique blend of properties ranging from residential homes in the City of Orillia and smaller towns to the rural areas in-between, as well as a mix of waterfront homes/cottages on the many rivers and lakes throughout our regions that range from the smaller entry level properties to the prestigious.

Muskoka Real Estate Update / Jan-Dec 2016

Cottage-winter-sunrise-Huntsville-Susan-Brown
JANUARY 19, 2017

2016 was a remarkable year for recreational property sales in Muskoka and nearby seasonal markets. It is difficult to pinpoint the reason for this increase in sales activity. 2016 was the second year in a row that saw sales grow fairly dramatically. Some of the factors at play are the following.

Firstly, the Muskoka and area market place is in close proximity to the greater Toronto area. Sales of residential resale properties in the greater Toronto area have, in the last two years, exploded. Sales have been strong in all price points, including the high-end properties (properties having a value exceeding $2 Million). Prices have correspondingly also increased, creating an urgency to get into the market. Real estate has come to be viewed as an asset that will ensure that buyers are not outdistanced by the ever-increasing value of resale properties. In the greater Toronto area residential property values increased by 20 percent in 2016 alone. In addition, there is a strong belief, supported anecdotally and statistically, that the market will remain strong, especially real estate values.

This prevailing attitude is no doubt behind the rising sales of recreational properties, not only in the Muskoka and related market places, but even further afield. Ironically, the increase in sales volume is having a dramatic impact on supply, consistent with the urban market experience. For example, at the end of December, the Toronto and area market place had 50 percent fewer listings than at December 2015. That is unprecedented. The recreational market place is beginning to mirror Toronto.

Supply will, although not to the same extent, become a concern in recreational markets. In 2016 the Association that manages listings for the Muskoka, Haliburton and Orillia market places published the following statistics. In 2015 the association processed 10,149 properties of all types on its multiple listing service. In 2016 that number decreased to only 8,976, a sharp decline of over 11 percent. At the end of December, there were 1466 active listings. At the end of December 2015 there were 2,290, a decline of almost 36 percent. The recreational property supply has also diminished in a startling way. At the end of December there were only 423 recreational properties available for sale. One might assume that since the recreational market is not active in the winter months that there is nothing exceptional about this number. However, when compared to 2015, it does give rise to some concern. Last year there were 656 properties available for sale. A decline of more than 35 percent is remarkable, even in the slowest season of the year for recreational property sales.

Except for Lake of Bays sales of recreational properties were strong in 2016. The Association reported that there were 1301 recreational properties sold in 2016. This compares with only 1098 in 2015, an increase of almost 20 percent. In 2014 there were only 890 reported sales.
The strongest recreational market place in 2016 was the Muskoka big lakes, Lake Rosseau, Joe and Muskoka. There were 350 reported sales on the big lakes, a 20 percent increase compared to the 291 sales in 2015, and a remarkable 32 percent increase compared to the 266 sales in 2014. What makes these sales eye- catching is the fact that the most expensive recreational properties in the region are located on the big lakes.

There was a considerable increase in activity in 2016 on Muskoka’s big lakes for properties having a value of $2 Million or more. In 2016 there were 21 sales in this category on the Lake Joe. The average sale price for these properties was $3,960,142. These 21 recreational properties sold in 95 days following their list date, and they sold for 95 percent of their original asking price. In 2015 there were only 14 sales in this category on Lake Joe. Although there were substantially fewer sales, the average sale price for the reported sales of these recreational properties was $4,512,564. They sold in just 58 days, but at 93 percent of their asking price.

On Lake Muskoka there were 20 reported sales in this category. The average sale price was $2,971,000. These recreational properties sold in 81 days following their list date, and they sold for 97 percent of their original asking price. In 2015 there were 18 sales on Lake Muskoka. The average sale price was $3,585,805.

They sold in 74 days at 94 percent of their original asking price.

In 2016 there were 24 sales of recreational properties that sold for $2 Million or more on Lake Rosseau. The average sale price of these properties was $3,533,250. They sold in 63 days and at 95 percent of their asking price. In 2015 there were only 10 sales in this category. Their average sale price was $3,093,863.

They sold in 140 days and at 94 percent of their asking price.

Clearly sales improved dramatically on the big lakes year over year in the $2 Million plus category. In 2016 there were a total of 65 sales. In 2015 there were only 42, an increase of 55 percent. The highest sale price was achieved on Lake Rosseau at $11,400,000. Unfortunately, it is difficult to determine an average increase in price year-over-year. Sales prices vary depending on location, elevation, exposure, water levels and more. Based on all the available data it is safe to say that prices increased between 5 to 10 percent in 2016 as compared to 2015.

Sales increased in the Haliburton region. There were 366 properties reported sold in all of 2016. This compares very favorably to the 319 sales in 2015, a 13 percent increase. The increase in sales is even more dramatic when compared to 2014. In 2014 there were only 246 sales of recreational properties in the region, an increase of almost 50 percent.

Lake of Bays appears to be out of sync with the overall market place. While the Muskoka Lakes and the Haliburton Highlands had double digit increases in sales year-over-year, the increase in sales in Lake of Bays was marginal. In 2016, 119 recreational properties were reported sold, a less impressive 5 percent increase. The reason why Lake of Bays did not produce as strong a positive variance that other regions did is due more to supply than demand.

Chestnut Park continues to be the market leader in Muskoka. Chestnut Park’s Port Carling office exceeded the dollar volume of sales of its closest competitor brokerage office by 78 percent. 2016 was Chestnut Park’s most successful year in serving its buyer and seller clients.

As 2017 begins we anticipate that the supply of recreational properties will become the market’s major concern. Urban markets, particularly the greater Toronto area, began experiencing shortages during the later half of 2015 and throughout 2016. As we enter the new year the lack of inventory has become critical. Although this is not yet the case in Muskoka and area, it appears to be heading in that direction. Unless a plethora of new listings come to market in the spring, we can anticipate substantial price increases, and multiple o ers on properties as a regular occurrence.

prepared by: Chris Kapches, LLB, President and CEO, Broker

(photo is provided by Susan Brown)

Muskoka Real Estate Market Update | January – July 2016

AdobeStock_94446345-e1471878766725
A sunset over the lake

A pattern has developed in the Muskoka and region recreational market place that most recently has been evident only in Ontario’s urban market places: a lack of property inventory. The greater Toronto area has been experiencing inventory shortages for more than 2 years. The situation is becoming one of concern. In centres such as Toronto, Hamilton and other large metropolitan areas there is little or no choice for buyers. Sellers who may want to buy up are not putting their properties on the market because there is little for them to buy, and when an appropriate property becomes available, they find themselves in competition.

The Muskoka and area recreational marketplace has not reached that acute state, but it is showing signs of doing so. The Lakelands Association of REALTORS® reports that to the end of July it processed 6,360 multiple listing service properties. This is a 12 percent decline compared to the 7,240 listings the Association processed to the end of July in 2015. The decline is even sharper if we focus exclusively on recreational properties. For example, at the end of July there were 1,212 recreational properties for sale across the greater Muskoka region. Last year there were 1,571, a concerning decline of almost 23 percent. In varying degrees the same is true in the 3 regions in which Chestnut Park and its agents primarily operate.

The Haliburton Highlands area reports a 33 percent decline in available listings at the end of July- this decline actually exceeds the decline being experienced in the greater Toronto area. At this time last year there were 395 recreational properties available for buyers to purchase. This year there are only 264. In the Lake of Bays area the decline is much less at 7 .6 percent. Last year there were 156 recreational properties available for sale, this year only 144. The decline in the Muskoka big lakes is also note-worthy. Last year there were 448 recreational properties for sale, this year more than 100 less at 34 7, a decline of more than 22 percent.

Not only is inventory declining, and to some extent because of these declines, except for the Lake of Bays area, there have been dramatic increases in sales. Throughout the greater Muskoka region, 721 multiple listing service sales were reported to the end of July, an eye-popping 22.4 percent increase compared to the same period last year. To put this in perspective, this percentage increase exceeds the increase in sales (by percentage) in the greater Toronto area. In the Haliburton Highlands, year to date reported sales are up by an astounding 33 percent. Last year to the end of July 165 recreational properties were reported sold, this year that number jumped to 220. Similar results are to be seen on Muskoka’s big lakes. Last year there were 163 reported sales of recreational properties, this year there have been 191 sales, a solid 17 .1 percent increase. Only Lake of Bays inexplicably has not seen an increase in sales. Last year there were 60, this year 56.

This year there have been 28 reported sales on Muskoka’s big lakes with a sale price exceeding $2 Million. One of these recreational properties sold for $9,335,000 and another for $11,400,000. Last year there were only 24 recreational property sales with sales prices exceeding $2 Million. Property sales having a sale price exceeding $1 Million increased dramatically as compared to 2015. In 2015 there were 104 properties in this category. This year that number jumped to 129, an increase of almost 25 percent.

Chestnut Park and its sales representatives continue to dominate the recreation marketplace in the Port Carling area. To the end of July, Chestnut Park reported almost 40 percent more sales in dollar volume than the next competitive office in the area. On a year to date basis Chestnut Park’s agents have been engaged in 142 recreational property sales. This is a new record for the Brokerage, surpassing the previous record of 112 property sales achieved by the end of July in 2015 and 2014. In dollar volume 2016 has also been a record year with Chestnut Park sales representatives engaging in more than $156 Million in recreational property sales, surpassing the previous record of $146 Million in sales achieved only last year.

Looking towards the later part of2016 and the fall market, the concern is inventory, particularly in the $1 Million to $1.8 Million price points. It is obvious that demand is strong, but there may not be sufficient inventory to satisfy it. As has been the case in urban markets, year over year sales of certain property types

(detached and semi-detached properties) have declined because of a lack of inventory. What has propped up the over-all market numbers, particularly in the greater Toronto area, has been the availability of condominium apartments, a property form that has had no impact on recreational markets.